NVIDIA Stock Analysis
(1999 – Q1 2025)
Insights, visualized growth, and market shifts
Welcome to the Journey
NVIDIA: Powering the AI Revolution
Founded in 1993 as a graphics chip company, NVIDIA is now the world’s most valuable public company, with a market cap topping $3.8 trillion as of mid-2025.
This meteoric rise wasn’t overnight. It’s the result of bold reinvestment in AI research, cutting-edge data center chips, and breakthrough architectures like Blackwell.
A company’s true growth goes beyond revenue, it’s in the stock price and the trust of its investors. When you keep investors happy, you unlock the capital needed to innovate and lead the industry.
What’s next?
Scroll down to see how the stock market “told the story” of NVIDIA from 1999 to Q1 2025. Each chart spotlights a big twist in the journey—price surges, volume spikes, and more.
Pro tip: Don’t forget to check out the interactive dashboard at the end for more story!
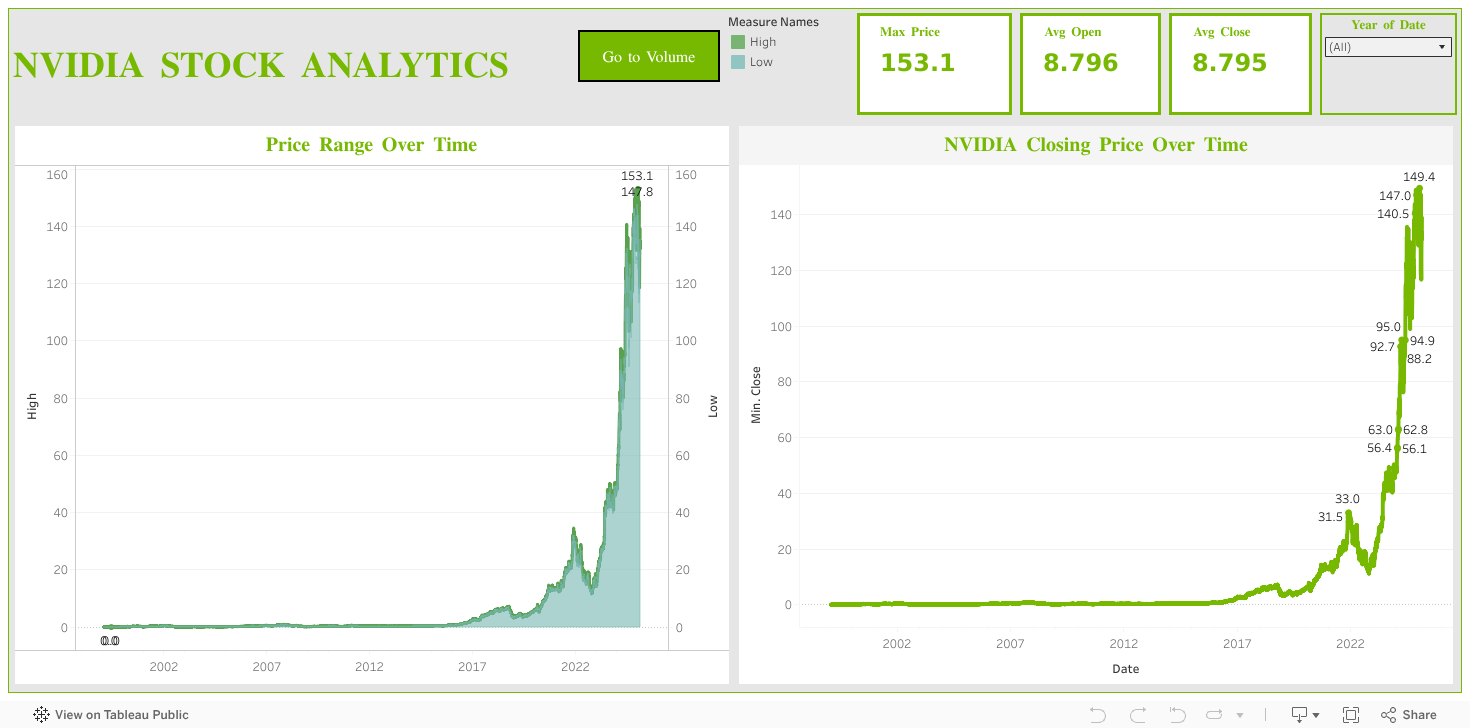
Adjusted Close Price Over Time

Insights
-
➤ Success & Impact
- → Massive rally since 2016: Stock took off with AI and data center adoption, becoming a tech market leader.
- → Pandemic boom (2020-2021): Stock hit all-time highs as gaming, crypto, and AI exploded globally.
- → 2023-2024 surge: Record gains, fueled by generative AI demand and NVIDIA’s dominant chip position.
-
➤ Lows & Why
- → 2008 financial crisis: Sharp drop as global markets crashed and tech spending stalled.
- → 2018 crypto bust: Price pulled back due to sudden fall in crypto-mining demand for GPUs.
Yeah... here we are
Most people don’t know what these numbers mean, I didn’t either at first. But here’s a quick rundown that’ll help you understand the visuals better:
- Open: Price when the stock started trading that day.
- Close: Price when the market closed.
- Adjusted Close: Close price adjusted for stock splits/dividends, more accurate for analysis.
- Dividends/Splits: When a company rewards shareholders with cash (dividends) or increases the number of shares you own (splits), but your total value stays the same.
- Volume: Total shares traded that day (high = hype).
- Daily Range: The difference between High and Low price in one day, shows volatility.
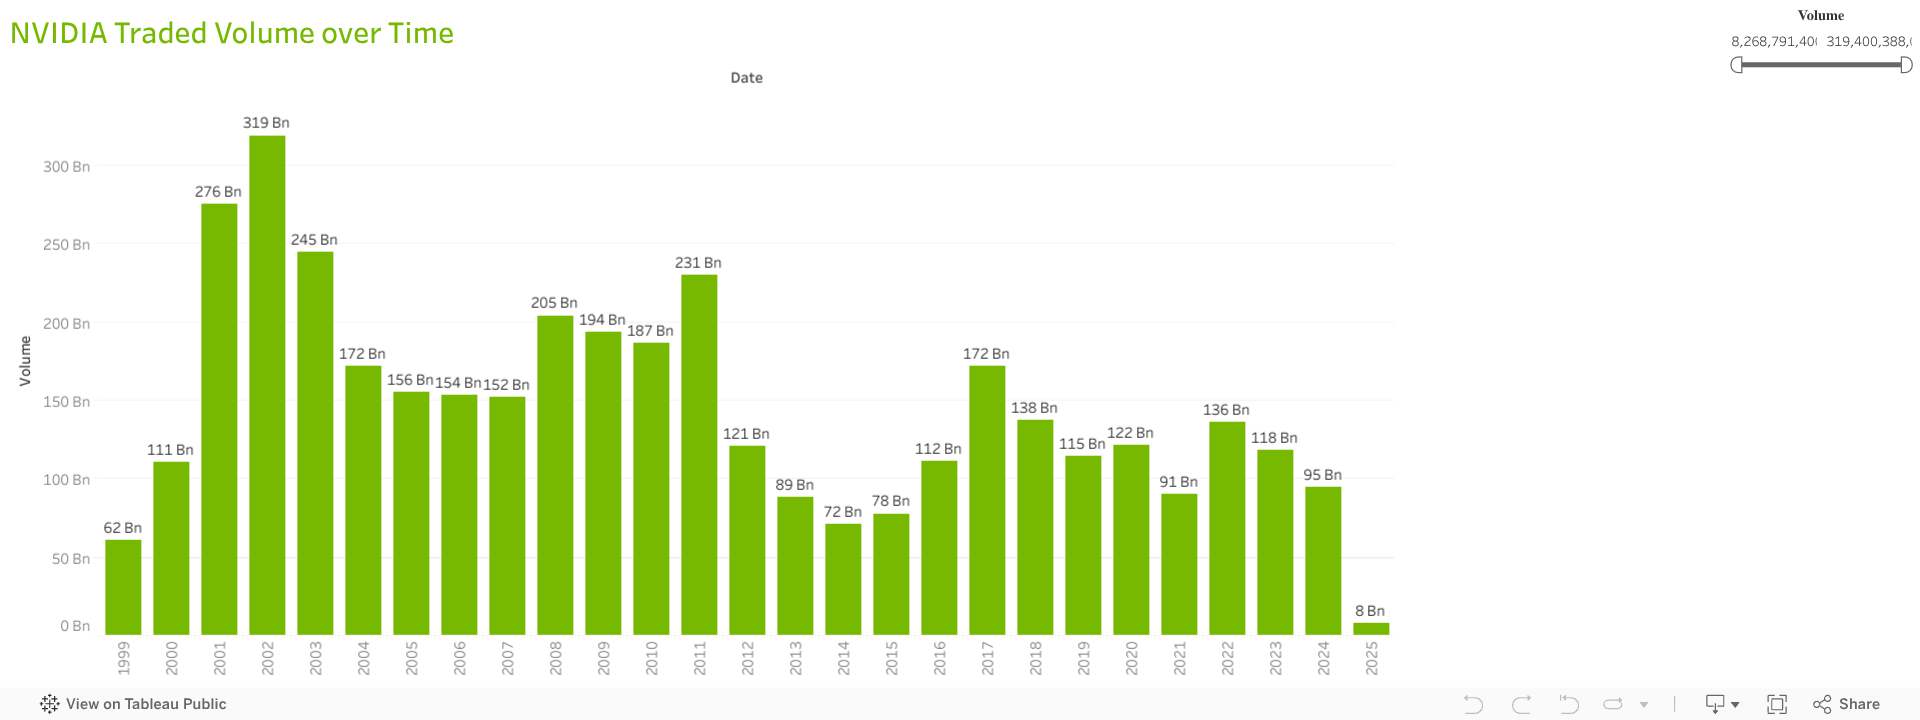
Volume Traded Over Time
Insights
-
➤ Success & Impact
- → Dot-com era peak (1999-2002): Trading volume soared as NVIDIA joined S&P500 and led tech hype.
- → 2017-2018 spike: Crypto and AI trends reignited investor interest, doubling trading activity.
- → 2022 rebound: Volume surged again as AI and tech optimism returned post-pandemic.
-
➤ Lows & Why
- → 2012-2014 stagnation: Trading at decade lows; NVIDIA was less visible as a growth stock.
- → 2021 anomaly: Stock soared, but volume dropped, many investors chose to hold, not trade.
Daily Price Range (High – Low)

Insights
-
➤ Success & Impact
- → Low volatility pre-2015: Stable daily moves reflected consistent, steady company growth.
- → Pandemic era 2020-2021: Volatility increased with rapid price gains and market attention.
- → 2023-2024: Extreme volatility: Huge daily swings as investors speculated on NVIDIA’s AI future.
-
➤ Lows & Why
- → 2008-2009 crash: Volatility spiked as shares plunged during global recession.
- → 2018 decline: Price range widened sharply as the crypto bubble burst, shaking investor confidence.
Volume vs Daily Price Range

Insights
-
➤ Success & Impact
- → High volume + high volatility (2002, 2008): Big market events drew massive interest and wild trading.
- → 2017 crypto/AI rally: Both volume and daily price range climbed as NVIDIA’s market role grew.
- → 2023-2024 AI boom: Unprecedented activity as the company became the face of generative AI.
-
➤ Lows & Why
- → 2012-2014 quiet phase: Both volume and price movement dropped; less attention from traders.
- → 2021 divergence: Price soared, but volume lagged, long-term investors held through the rally, creating a supply shortage.
Explore the Full Interactive Dashboard
Tip: For the best experience, click the fullscreen button at the bottom right corner of the dashboard.